Wire-to-Water 💡⚡
Well Efficiency Analysis
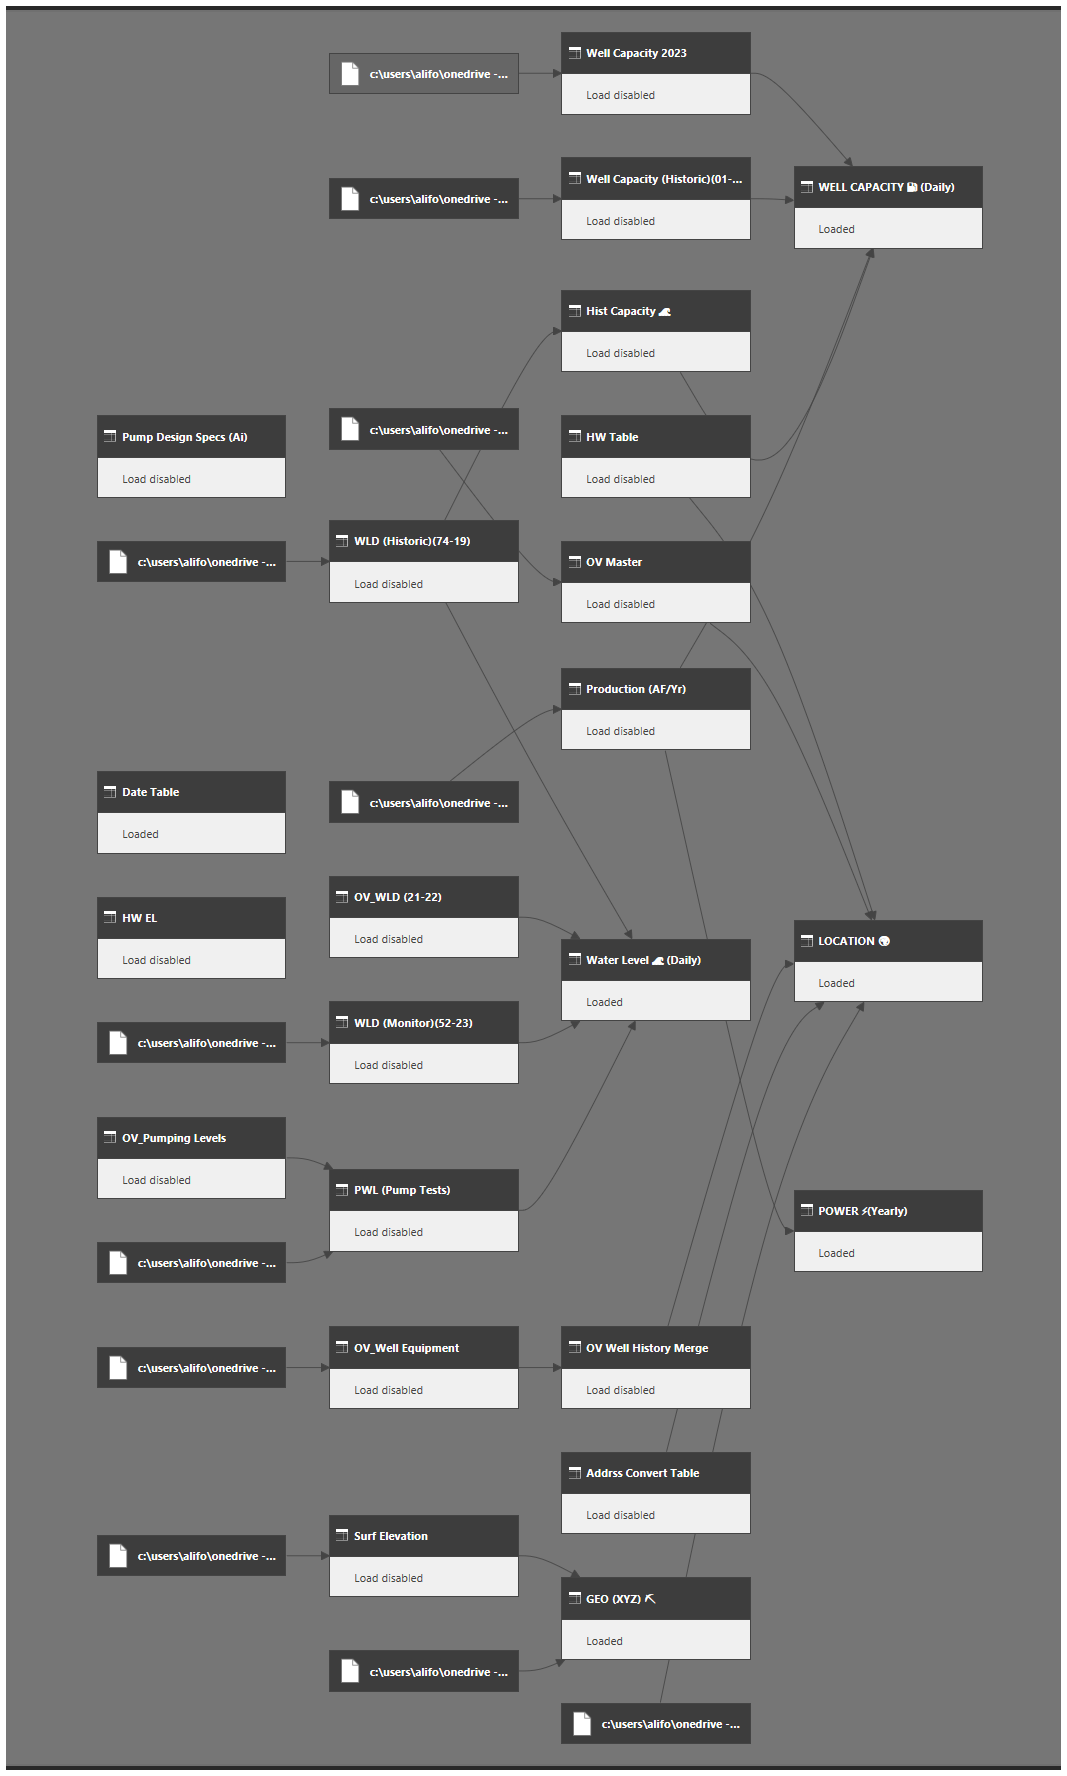
From Fragmented Records to a Shared Source of Truth
This project started with a familiar problem:
critical system data existed, but it was scattered—across spreadsheets, PDFs, legacy exports, and one-off analyses built for specific questions.
Production, power, water levels, pump tests, design specs, and location data all told part of the story, but never in one place—and rarely in a way that stayed consistent over time.
The work focused on centralizing these sources into a single analytical backbone, where each dataset keeps its meaning and history, but connects cleanly to the others.
📚 Historical records preserved
⚙️ Operational data kept at native resolution
🗓️ Time aligned across daily, yearly, and event-based data
🌍 Location and well identity resolved once—and reused everywhere
By structuring the data first, the dashboards and analyses that followed became easier to trust.
Questions about efficiency, cost, and performance could be answered without re-building logic each time—or wondering which spreadsheet was “the right one.”
This foundation turned analysis from a one-off exercise into something repeatable, auditable, and shared—so conversations could focus on what the system is doing, not on reconciling inputs.
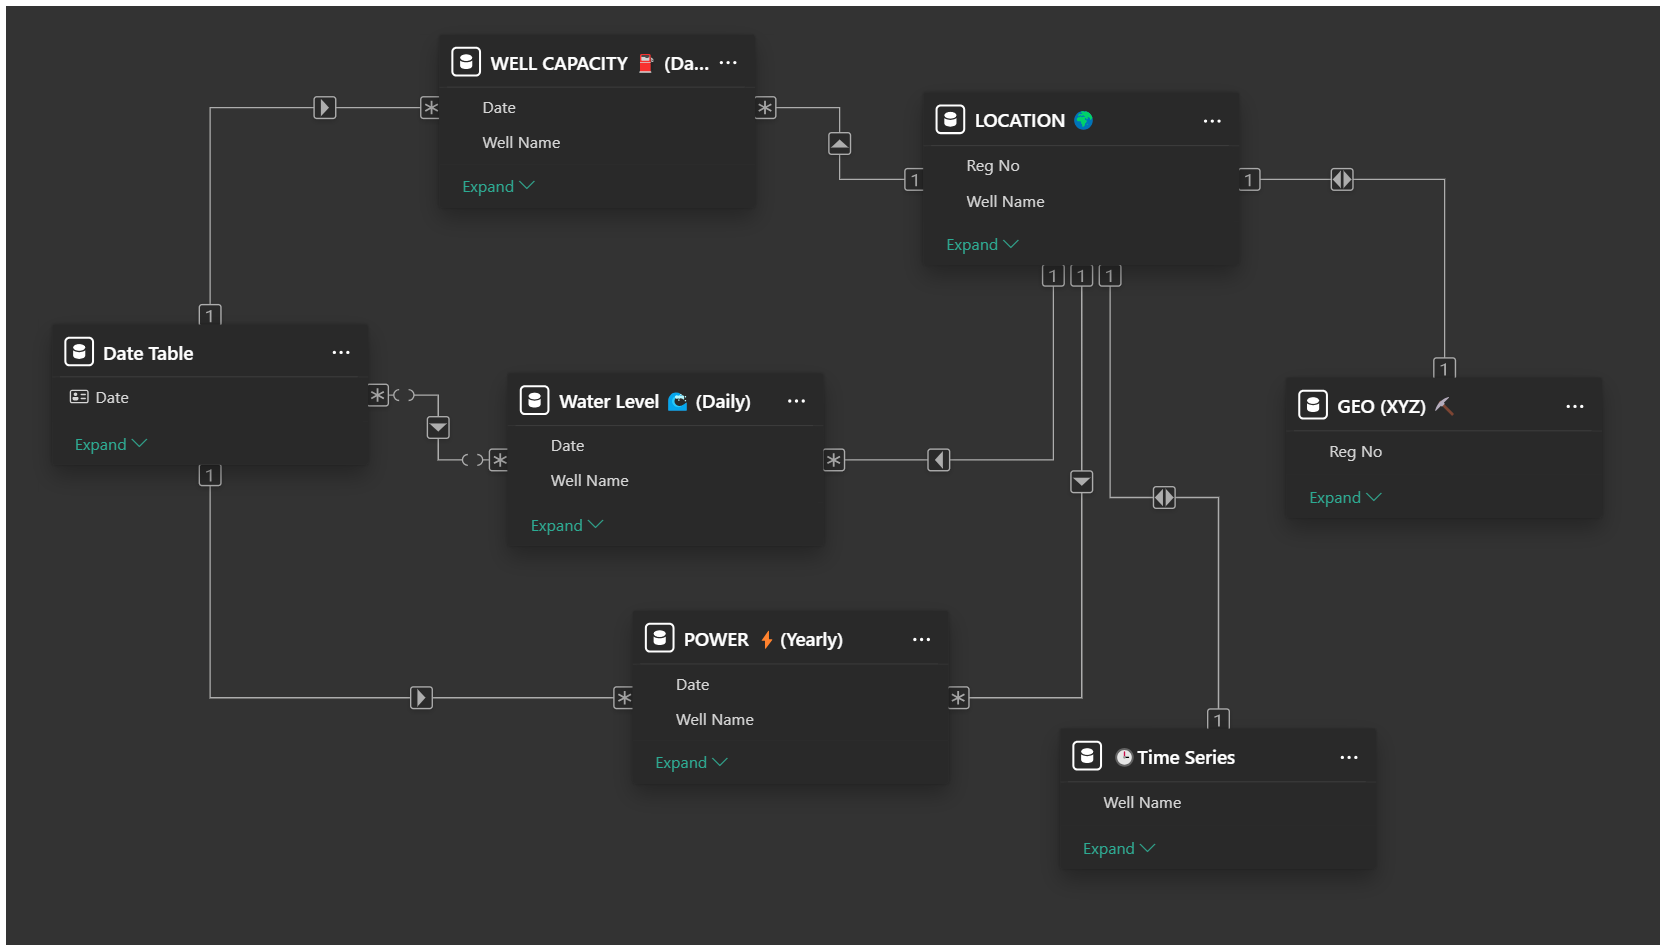
Data Model — How the Pieces Connect
This view shows how production, power, water levels, capacity, and location are connected behind the scenes—before anything appears on a chart.
Instead of blending everything into a single table, each dataset keeps its own grain and meaning, linked through shared keys and time.
🧱 Separation by purpose
Daily water levels, yearly power data, and capacity records remain independent but coordinated
🗓️ Time-aware structure
A central date table ensures trends, comparisons, and rollups behave consistently
🌐 Location as context
Spatial and registration data anchor performance to real places, not just names
This structure makes it possible to ask nuanced questions—
How did efficiency change when water levels dropped?
Which wells are driving energy cost increases?
—and trust that the answers reflect the system as it actually operates, not artifacts of the data.
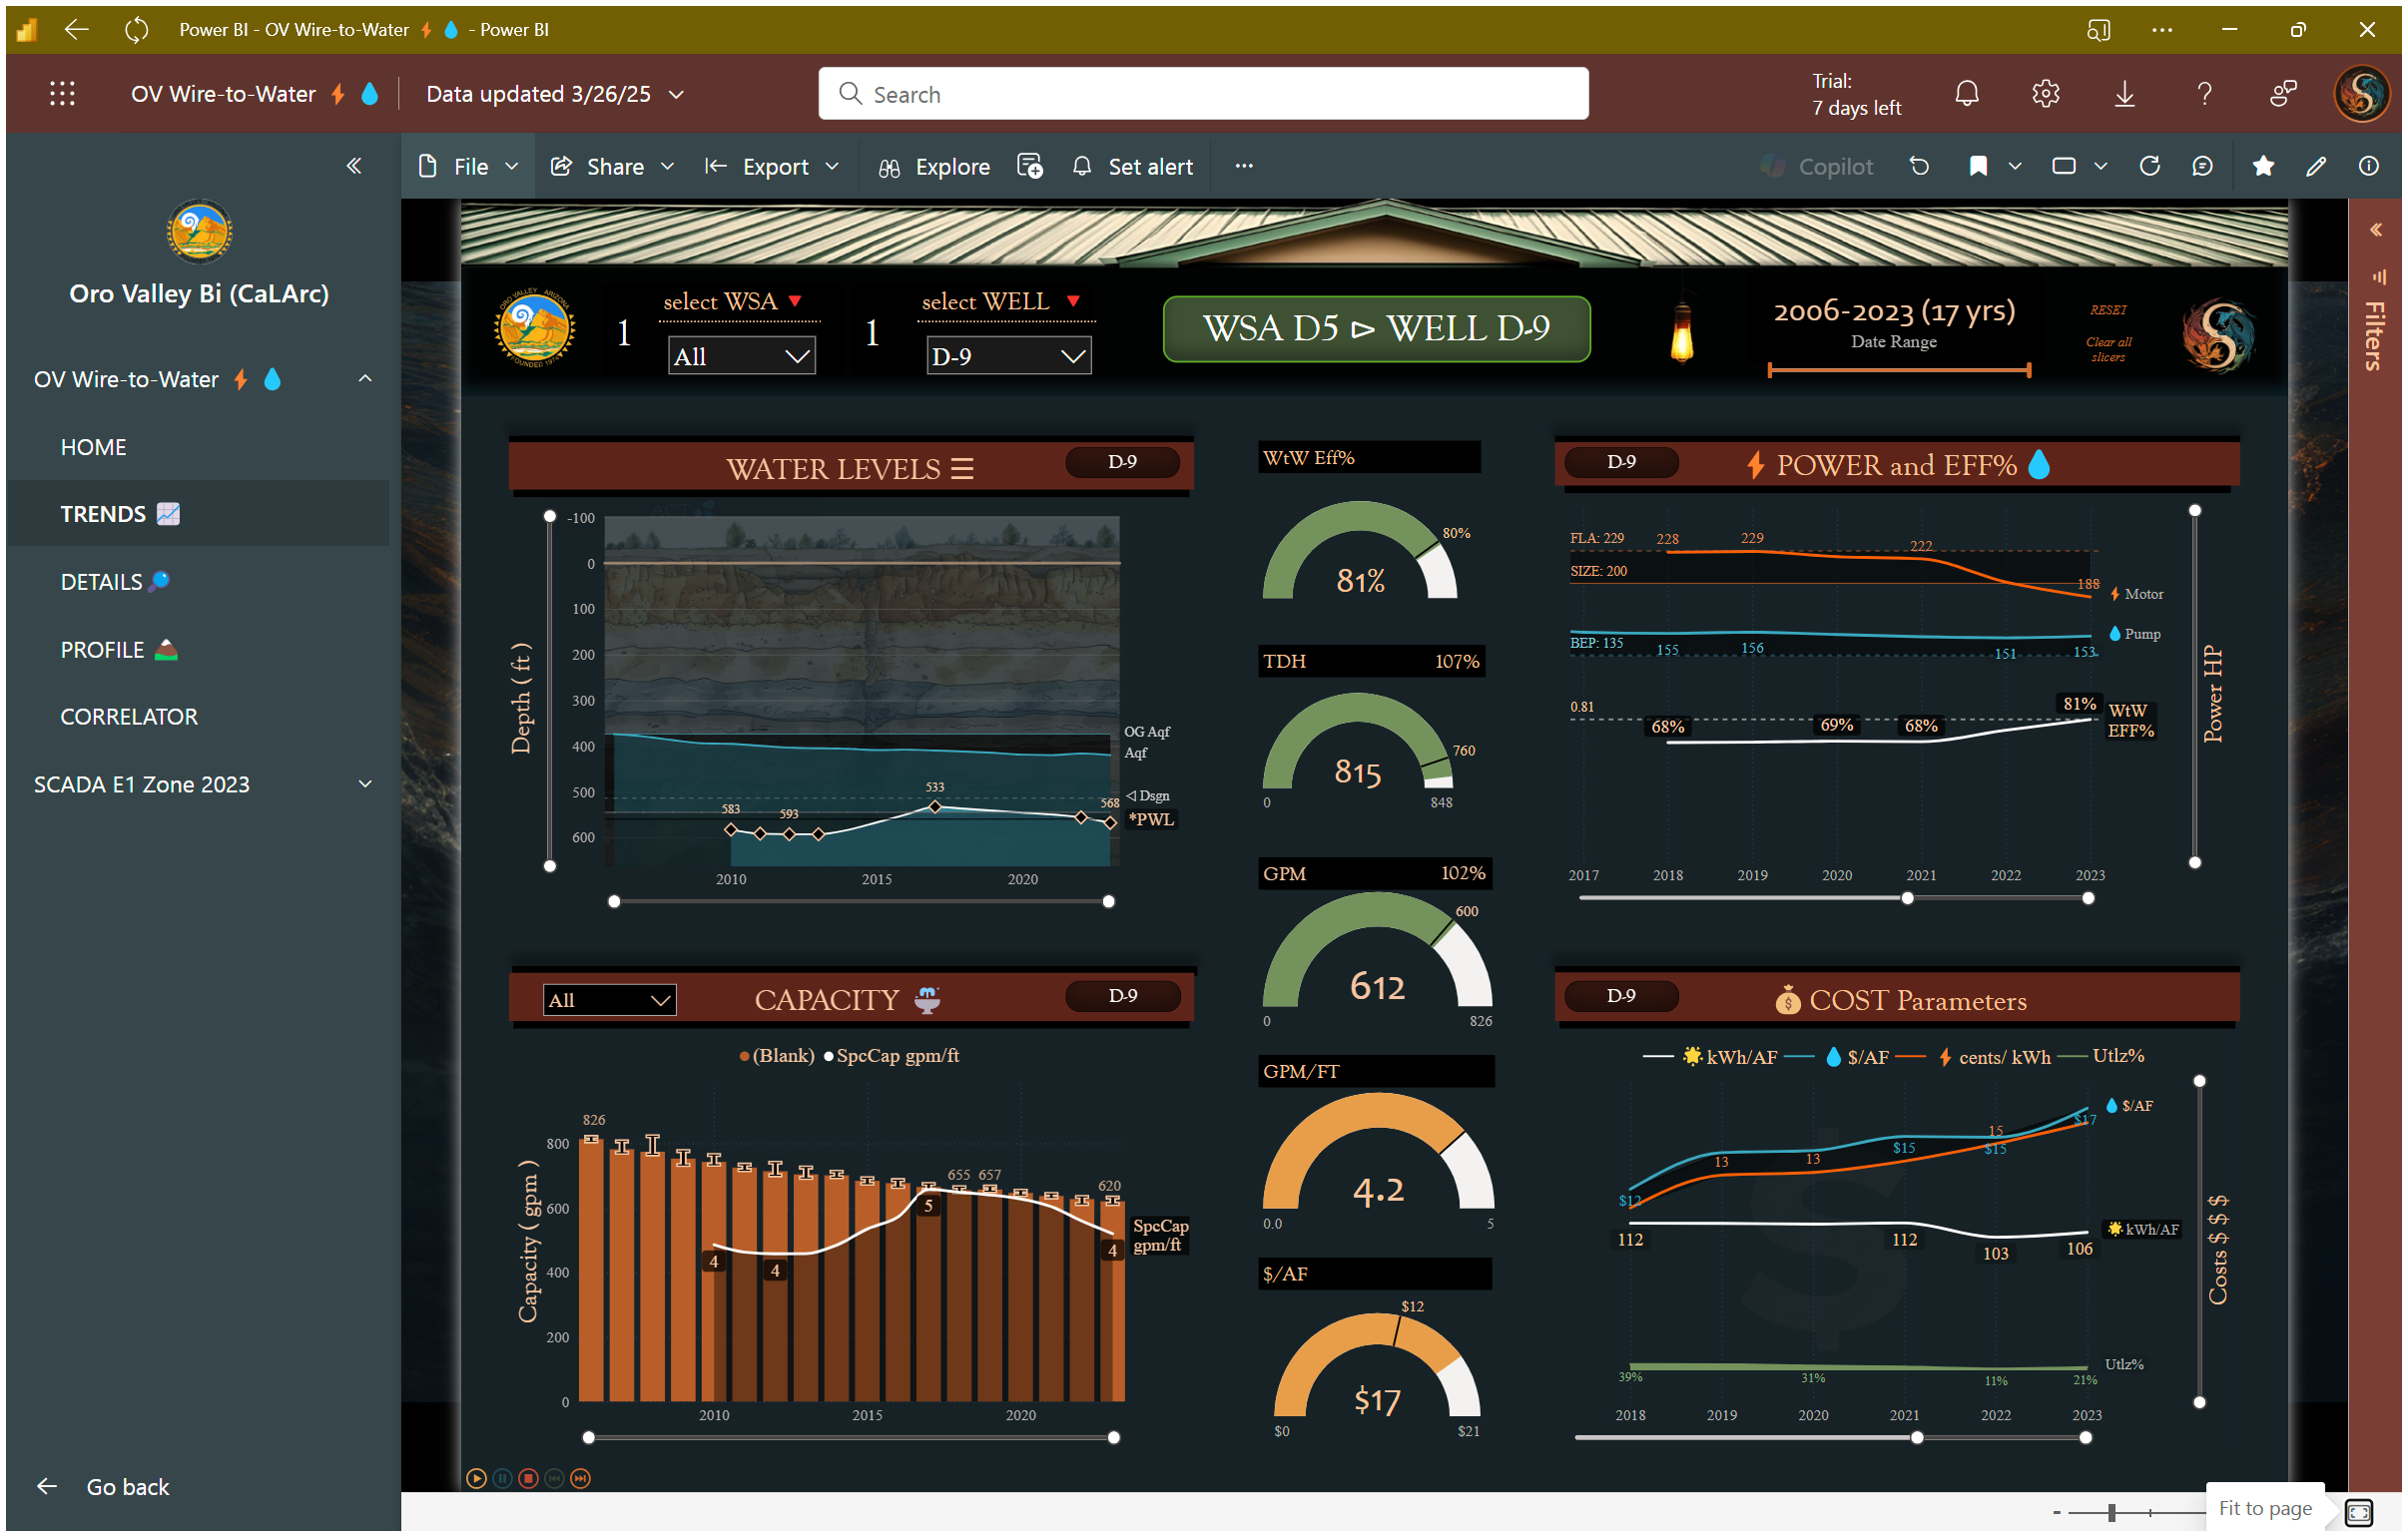
Well-Level Performance, Over Time
This view brings together production, energy, water levels, and cost
for a single well, shown across nearly two decades of operation.
🔍 Performance trends
How output and efficiency have shifted year over year
⚡ Energy use
What it costs — in power and dollars — to move water through the system
💧 Water levels
How aquifer conditions influence performance and efficiency
By pairing operational metrics with long-term context, this view supports
faster, more grounded conversations about how a well is really behaving —
not just how it looks on paper.
Well-Detail_Design Intent vs. Reality
This view compares how the well was designed to operate
with how it is actually operating today.
🛠️ Drift from design conditions
Gradual movement away from expected operating ranges
📐 Increasing system demand
Additional head the system is asking for over time
⚡ Efficiency impacts
What those shifts mean for energy use, cost, and wear
Seeing design assumptions and field behavior side-by-side makes it easier to talk about
maintenance, rehabilitation timing, and future replacement —
using shared evidence instead of gut feel.

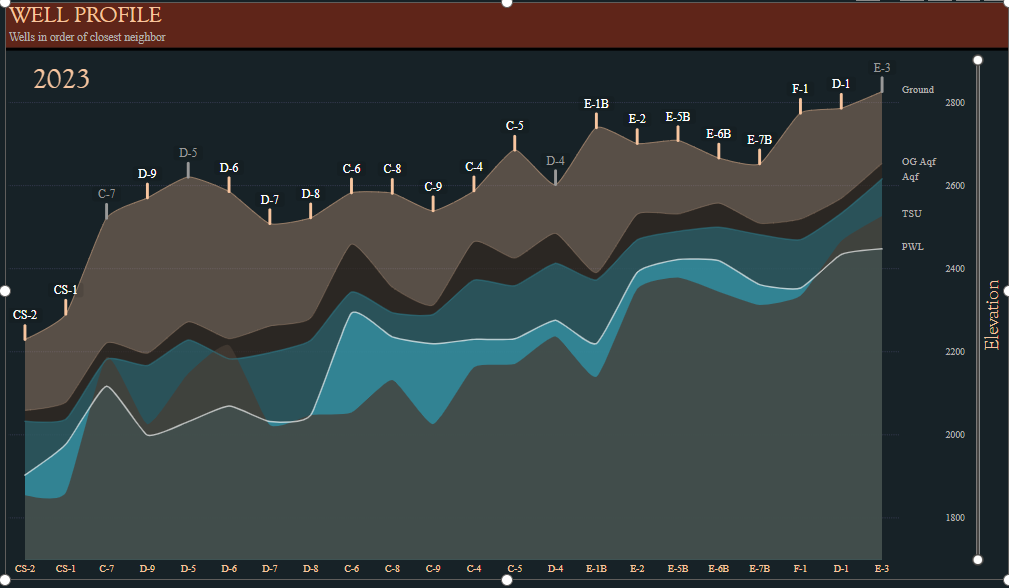
System Cross-Section — Wells in Context
This view lays out multiple wells side-by-side along a system transect, showing how each one sits within the broader geologic and hydraulic context.
Ground surface, aquifer layers, well construction, and pumping levels are shown together so patterns emerge visually — not buried in tables.
🪨 Geologic context
Upper and lower aquifer zones relative to ground surface
🛢️ Well construction
Casing depth, screened intervals, and total setting
📉 Pumping levels
Static and pumping water levels compared across wells
What becomes clear is how depth, geology, and operating conditions vary across the system, and why individual wells behave differently even when they serve the same utility.
Seeing the system this way helps shift conversations from
“Why is this well underperforming?”
to
“What constraints is this well operating under?”